Description
This track represents the ReMap Atlas of regulatory regions, which consists of a
large-scale integrative analysis of all Public ChIP-seq data for transcriptional
regulators from GEO, ArrayExpress, and ENCODE.
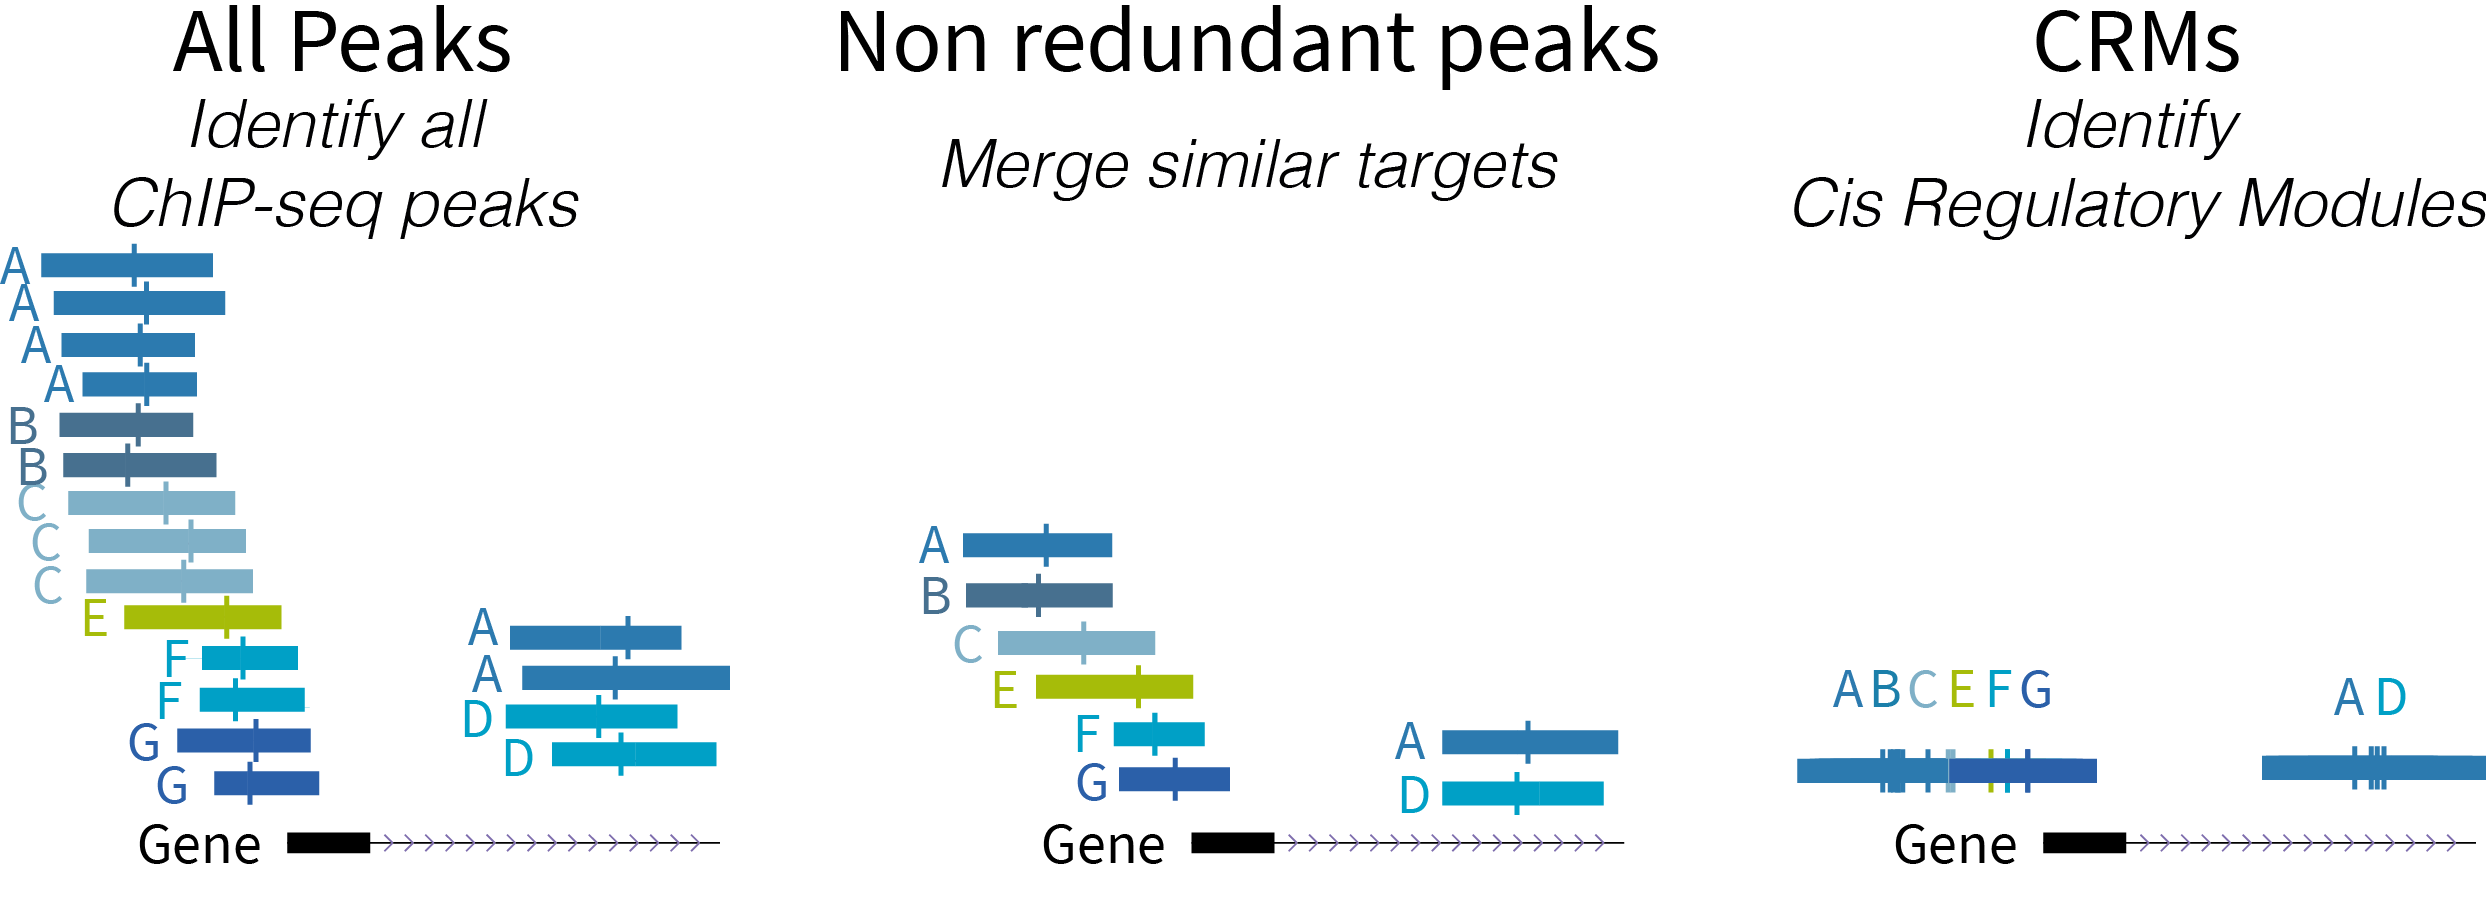
Below is a schematic diagram of the types of regulatory regions:
- ReMap 2022 Atlas (all peaks for each analyzed data set)
- ReMap 2022 Non-redundant peaks (merged similar target)
- ReMap 2022 Cis Regulatory Modules

Display Conventions and Configuration
-
Each transcription factor follows a specific RGB color.
-
ChIP-seq peak summits are represented by vertical bars.
-
Hsap: A data set is defined as a ChIP/Exo-seq experiment in a given
GEO/ArrayExpress/ENCODE series (e.g. GSE41561), for a given TF (e.g. ESR1), in
a particular biological condition (e.g. MCF-7).
Data sets are labeled with the concatenation of these three pieces of
information (e.g. GSE41561.ESR1.MCF-7).
-
Atha: The data set is defined as a ChIP-seq experiment in a given series
(e.g. GSE94486), for a given target (e.g. ARR1), in a particular biological
condition (i.e. ecotype, tissue type, experimental conditions; e.g.
Col-0_seedling_3d-6BA-4h).
Data sets are labeled with the concatenation of these three pieces of
information (e.g. GSE94486.ARR1.Col-0_seedling_3d-6BA-4h).
Methods
This release of ReMap (2022) presents the analysis of 5,505 quality controlled
mouse ChIP-seq (n=7,317 before QCs) from public sources (GEO & ENCODE). Those
ChIP-seq data sets have been mapped to the GRCm38/mm10 mouse assembly. The data
set is defined as a ChIP-seq experiment in a given series (e.g. GSE122715),
for a given TF (e.g. USF1), in a particular biological condition (i.e. cell
line, tissue type, disease state, or experimental conditions; e.g. mESC).
Data sets were labeled by concatenating these three pieces of information, such
as GSE122715.USF1.mESC.
Those merged analyses cover a total of 656 DNA-binding proteins
(transcriptional regulators) such as a variety of transcription factors (TFs),
transcription co-activators (TCFs), and chromatin-remodeling factors (CRFs) for
123 million peaks.

ENCODE
Available ENCODE ChIP-seq data sets for transcriptional regulators from the
ENCODE portal were processed with the
standardized ReMap pipeline. The list of ENCODE data was retrieved as FASTQ files from the
ENCODE portal
using filters. Metadata information in JSON format and FASTQ files were retrieved using the Python
requests module.
ChIP-seq processing
Both Public and ENCODE data were processed similarly. Bowtie 2 (PMC3322381) (version 2.2.9) with options -end-to-end -sensitive was used to align all
reads on the genome. Biological and technical
replicates for each unique combination of GSE/TF/Cell type or Biological condition
were used for peak calling. TFBS were identified using MACS2 peak-calling tool
(PMC3120977) (version 2.1.1.2) in order to follow ENCODE ChIP-seq guidelines,
with stringent thresholds (MACS2 default thresholds, p-value: 1e-5). An input data
set was used when available.
Quality assessment
To assess the quality of public data sets, a score was computed based on the
cross-correlation and the FRiP (fraction of reads in peaks) metrics developed by
the ENCODE Consortium (https://genome.ucsc.edu/ENCODE/qualityMetrics.html). Two
thresholds were defined for each of the two cross-correlation ratios (NSC,
normalized strand coefficient: 1.05 and 1.10; RSC, relative strand coefficient:
0.8 and 1.0). Detailed descriptions of the ENCODE quality coefficients can be
found at https://genome.ucsc.edu/ENCODE/qualityMetrics.html. The
phantompeak tools suite was used
(https://code.google.com/p/phantompeakqualtools/) to compute
RSC and NSC.
Please refer to the ReMap 2022, 2020, and 2018 publications for more details
(citation below).
Data Access
ReMap Atlas of regulatory regions data can be explored interactively with the
Table Browser and cross-referenced with the
Data Integrator. For programmatic access,
the track can be accessed using the Genome Browser's
REST API.
ReMap annotations can be downloaded from the
Genome Browser's download server
as a bigBed file. This compressed binary format can be remotely queried through
command line utilities. Please note that some of the download files can be quite large.
Individual BED files for specific TFs, cells/biotypes, or data sets can be
found and downloaded on the ReMap website.
References
Chèneby J, Gheorghe M, Artufel M, Mathelier A, Ballester B.
ReMap 2018: an updated atlas of regulatory regions from an integrative analysis of DNA-binding ChIP-
seq experiments.
Nucleic Acids Res. 2018 Jan 4;46(D1):D267-D275.
PMID: 29126285; PMC: PMC5753247
Chèneby J, Ménétrier Z, Mestdagh M, Rosnet T, Douida A, Rhalloussi W, Bergon A, Lopez
F, Ballester B.
ReMap 2020: a database of regulatory regions from an integrative analysis of Human and Arabidopsis
DNA-binding sequencing experiments.
Nucleic Acids Res. 2020 Jan 8;48(D1):D180-D188.
PMID: 31665499; PMC: PMC7145625
Griffon A, Barbier Q, Dalino J, van Helden J, Spicuglia S, Ballester B.
Integrative analysis of public ChIP-seq experiments reveals a complex multi-cell regulatory
landscape.
Nucleic Acids Res. 2015 Feb 27;43(4):e27.
PMID: 25477382; PMC: PMC4344487
Hammal F, de Langen P, Bergon A, Lopez F, Ballester B.
ReMap 2022: a database of Human, Mouse, Drosophila and Arabidopsis regulatory regions from an
integrative analysis of DNA-binding sequencing experiments.
Nucleic Acids Res. 2022 Jan 7;50(D1):D316-D325.
PMID: 34751401; PMC: PMC8728178
|
|