- Home
- Genomes
- Genome Browser
- Tools
- Mirrors
- Downloads
- My Data
- Projects
- Help
- About Us
Session Gallery
Session Gallery
- DNA/Codon View
- Evolution
- SNPs and Disease
- Expression/Regulation: TFBS/RNA-seq/ChIP-seq
- Mailing List Support
More Information about Sessions
- What is a Session?
- What is the Session Gallery?
- Don't copy that link -- make a Session!
- Custom Track Caveats
DNA/codon view
Examples of stop codons in the hg19 assembly

The above session helps illustrate the display of how one gene can have different transcripts with different stop codons, displayed in red in the browser. Note that the three transcripts that terminate near the right side of the screen are in a different frame from the transcript that terminates near the left side. The three potential reading frames through the region can be seen at the top of the graphic. Only one of the three is free of stop codons throughout this range.
Premature Stop in the hg18 Reference Assembly
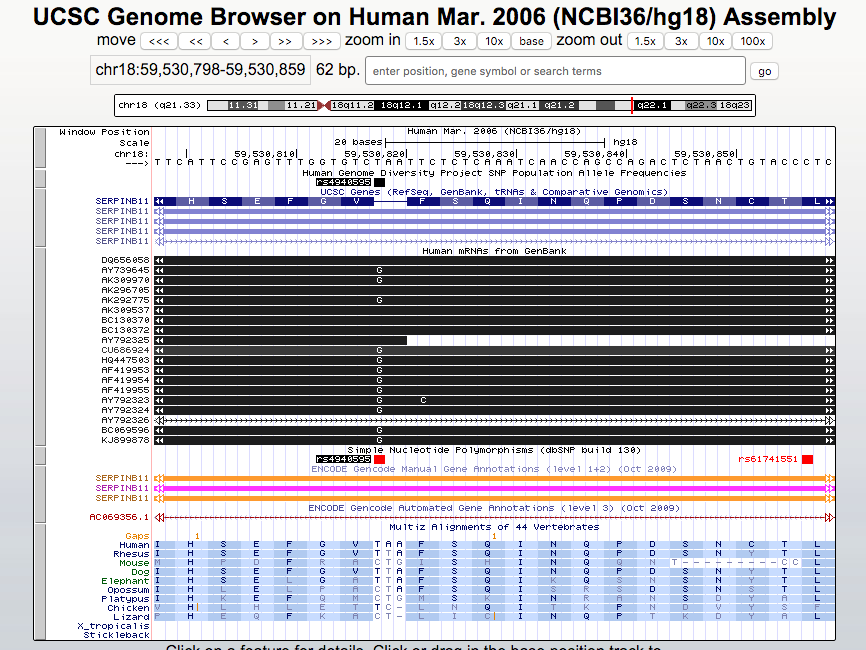
A premature stop codon was found in the hg18 reference genome and in about half of people of
European descent. The UCSC Genes track was forced to skip the codon to indicate a full-length coding
region for this gene. The SNP indicated by the G nucleotide in many of the mRNA alignments shows
that in many samples from Genbank, the T > G transversion encodes a glutamic acid in the protein,
reading through the premature stop predicted by the reference assembly.

Clicking the top highlighted rs4940595 in the Human Genome Diversity Project SNP Population Allele Frequencies track will display the world frequency image regarding this variant. In the more recent hg38 reference genome this area displays differently. Click into the active session and then into the SNP to read the details. Link to region in hg38 for comparison. Specifically, in hg38 the T in the previous reference assembly has been replaced by a G, giving the reference a glutamic acid, E, and no longer prematurely truncates the predicted transcript. The SNP at this location, rs4940595, now indicates the G > T transversion in the reverse direction from previously, indicating a premature stop at this location for the T allele.
Examples of Start Codons in the hg19 Assembly

The above session helps illustrate the display of how one gene can have different transcripts with different start codons, displayed in green in the browser. Here is an example session displaying a start codon on the reverse strand. By clicking the "reverse" button below the browser one can flip the view.
Examples of Split Codons in the hg19 Assembly
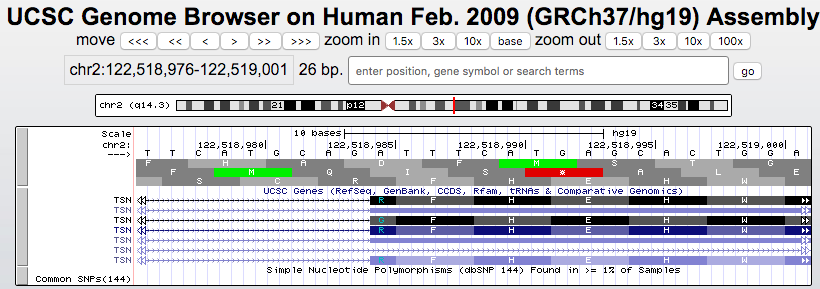
The above session helps illustrate how a codon can be split between splice sites. By clicking the little double-headed arrow on the left of one of the transcripts one can see the other part of the codon. Note that there are different AAs (G or R) depending on the different splicing upstream for different isoforms.

Using the multi-region exon-only feature available under the top blue menu bar and View selecting "Multi-Region" you can remove introns adjusting padding down to just one base (or none) to more clearly see the split codon above.
Examples of Different Codon Numbering in the hg19 Assembly

The above session helps illustrate the how same region in an exon can have different codon numbering reflecting different isoforms and that it is important to use caution when reading codon numbers in the literature. Here is an additional view of the region zoomed out 300x to display the alternate splicing.
Evolution
Examples of Codon Wobble in the hg19 Assembly

The above session helps illustrate how codon wobble in bases diverges through evolution when the amino acid is the same (note the conservation score graph). There is a conservation of function through evolution with V > I > F amino acids and K > R substitutions. Here is an additional example session displaying wobble.
Examples of Evolution in the hg19 Assembly

This session shows alignments of three species (Chimp, Gorilla, and Orangutan) against chr2 in hg19 and how the same sequences are found in two separate chromosomes in the other species.

Zooming in above to a region of human chr2 you can see heterochromatin around a vestigial centromere
which has not evolved away yet. By using the top blue menu bar under View to select "In Other
Genomes (Convert)" you can select the Chimp assembly panTro4 and see that these coordinates in
hg19 (chr2:126,645,017-138,651,416) coincide with the centromere in the Chimp chr2B:

SNPs and disease
Examples of SNP coloring and ABO variant details in the hg19 Assembly
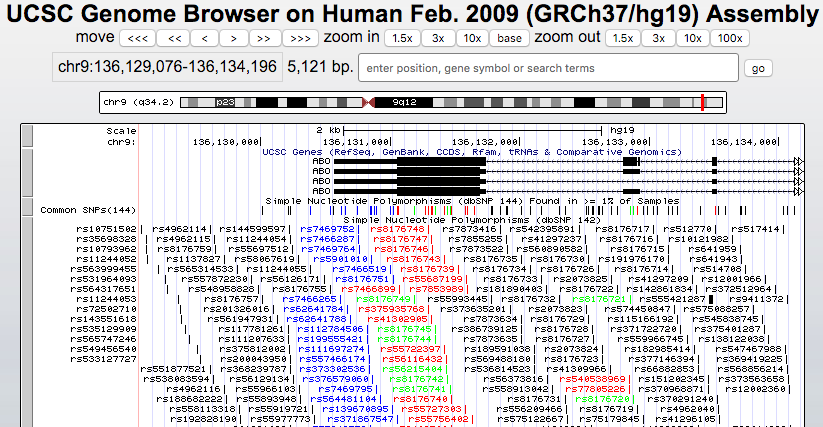
The above session helps illustrate how SNPs are color coded regarding whether they represent a nonsense, missense, or frameshift variation. These SNPs are around the ABO gene and represent blood group variation.
By clicking into the gene track for one of the isoforms of the ABO gene one can see additional variant details by clicking the "Gene Alleles" link to jump down to the "Common Gene Haplotype Alleles" section and mouseover highlighted variant amino acids to see changes in nucleotide and AA sequences.
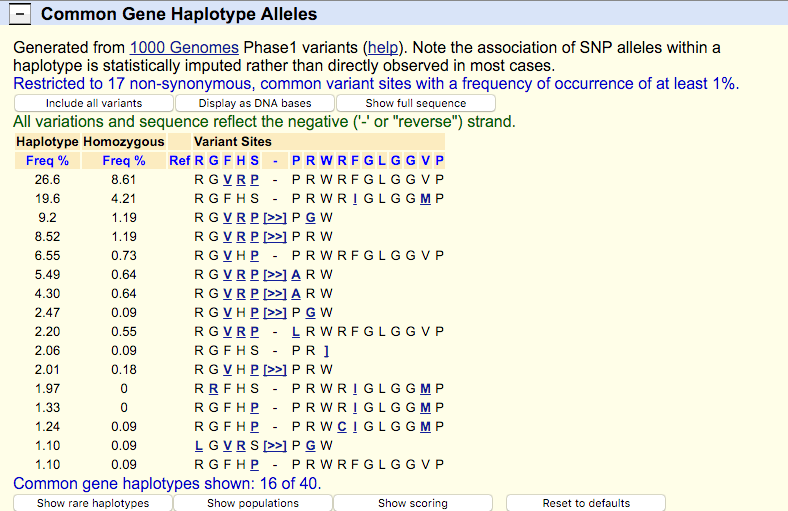
Examples of OMIM allelic variants in the hg19 Assembly
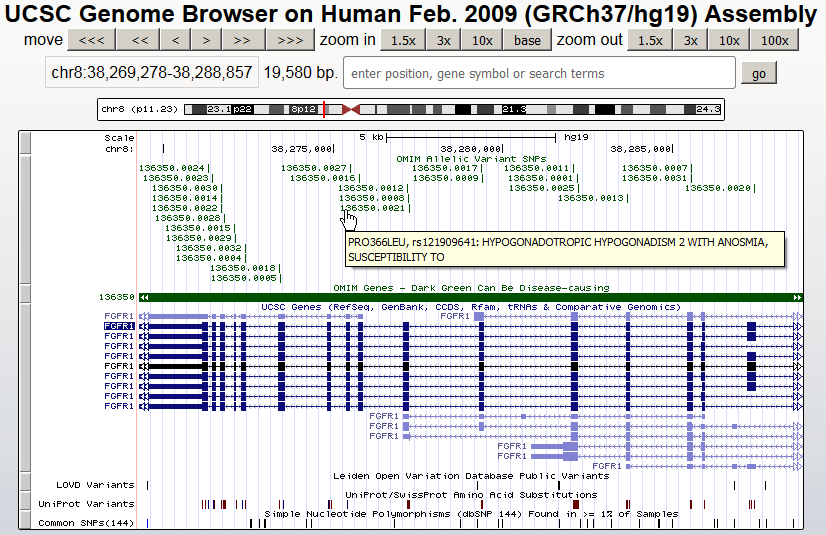
The top track in the above session displays OMIM allelic variants. By clicking the items one can learn the details and find additional links to the allelic variants in the Online Mendelian Inheritance in Man (OMIM) database.
In the above and this zoomed in session you can mouseover OMIM variants to access details such as OMIM Allelic Variant 136350.0021 in the far right to see "PRO366LEU,rs121909641:HYPOGONADOTROPIC HYPOGONADISM 2 WITH ANOSMIA, SUSCEPTIBILITY TO" to learn additional information about each variant.
Examples of CAG Repeats in Huntingtin in the hg19 Assembly

The above session uses the Short Match Track to display matches of "cagcagcagcagcagcag" repeats in a polyglutamine region (Note Qs) of the gene HTT, Huntingtin, linked to Huntington's disease.
Examples of Segmental Duplications in the hg19 Assembly

The above session uses the Segmental Dups to display regions detected as putative genomic duplications within the golden path and shows X-linked colorblindness as a recombination hotspot in the opsin region where genes encode for light absorbing visual pigments.
Another example featuring the Segmental Dups track is the 15q11 Prader-Willi region in which same-chromosome duplications lead to gain and loss of copies and a rare genetic disorder when some genes are deleted or unexpressed.
Expression/regulation: TFBS/RNA-seq/ChIP-seq
Microarray Probset data in the hg19 Assembly

The above session uses the Microarray Probesets track to display Affymetrix, Agilent, and Illumina probe information.
View ENCODE data (2003 - 2012) in the UCSC Genome Browser

The above session highlights some key integrated track data from the ENCODE project including GENCODE gene sets, Transcription Levels by RNA-seq, H3K27Ac histone mark, DNaseI Hypersensitivity, ChIP-seq Transcription Factor binding sites, and Genome Segmentations.
Example search of enhancer information around the gene TNFAIP3

This session comes from a question regarding how to search for enhancer RNA for the gene TNFAIP3. The response displays the various ENCODE tracks around the gene TNFAIP3 indicating where DNase activity, Transcription Factor Binding, RNA transcription, and histone modification has been observed. The layered H3K4Me1 and layered H3K27Ac tracks show where modification of histone proteins is suggestive of enhancer and other regulatory activity. Investigating where RNA-seq signals overlap with Transcription Factor Binding upstream of TNFAIP3 transcription would appear to indicate possible eRNA locations and the segmentation track displays possible Strong and Weak Enhancers as calculated by the ChromHMM and Segway programs.
Example of how DNaseI Hypersensitivity Clusters track represents multiple experiments

This session comes from a question about how the DNaseI Hypersensitivity Clusters track is generated. The response explains that the clusters track represents the combining and filtering of multiple DNaseI Hypersensitivity Uniform Peaks tracks in an attempt to summarize multiple individual experiments, which also can be viewed individually in the browser.
Example of how the Transcription Factor ChIP Track is generated from multiple experiments
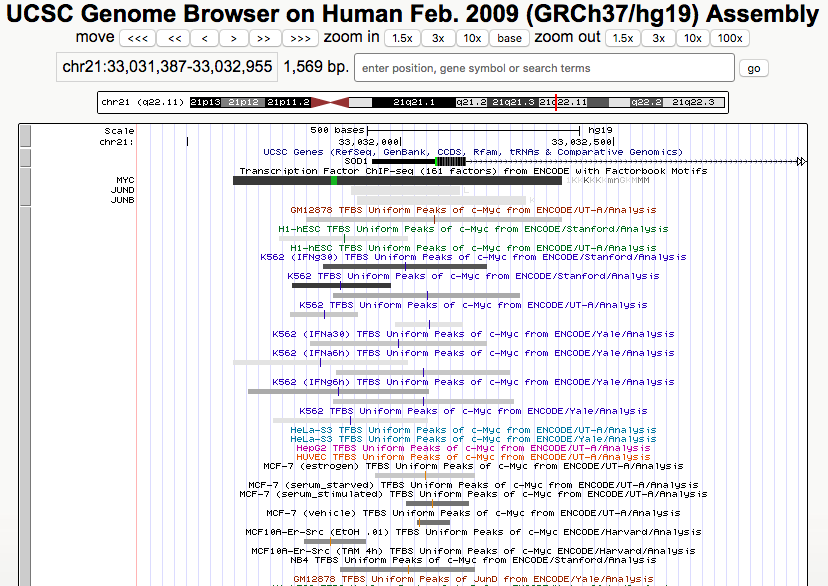
This session helps illustrate the process behind creating the TFBS Clusters track. Uniform processing resulted in a comparable signal scores viewable in the wgEncodeAwgTfbsUniform track, that was then used to generate the clustered score in the wgEncodeRegTfbsClusteredV3 track, where a normalization factor was used to attempt to better distribute scores evenly. The session originated from a question regarding whether it was correct to interpret the darker score as increased biological evidence of binding for a transcription factor at a particular spot. The response shared how by filtering to display only the JUN, JUNB, JUND, and MYC factors you can see several individual "Uniform ...c-Myc" tracks displayed below the clusters track. Those are the separate wgEncodeAwgTfbsUniform tracks used to generate the processed clustered summary wgEncodeRegTfbsClusteredV3 track for this MYC cluster. Those individual uniform processed scores were used to create the cluster score given to the MYC cluster. Like the MYC factor, you can also click the JUN factors and you will see there is only one observed cell type where this data indicates this factor binds at this location. And similarly below, you will see the "Uniform... Jun" tracks that contributed to the clusters track.
Mailing list support
Example of displaying repeats in the hg19 Assembly
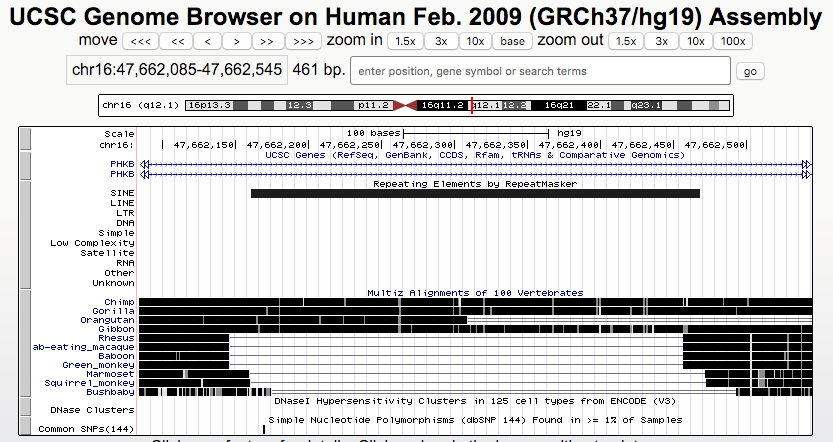
A user was interested in an intron of the gene PHKB where a repeat element for AluY was given. The user could not find the Alu repeat, and the response was to aid the user in turning on the RepeatMasker track where information on repeats, such as the AluY element desired, is contained.
Example of refGene exonFrames coming from mRNA
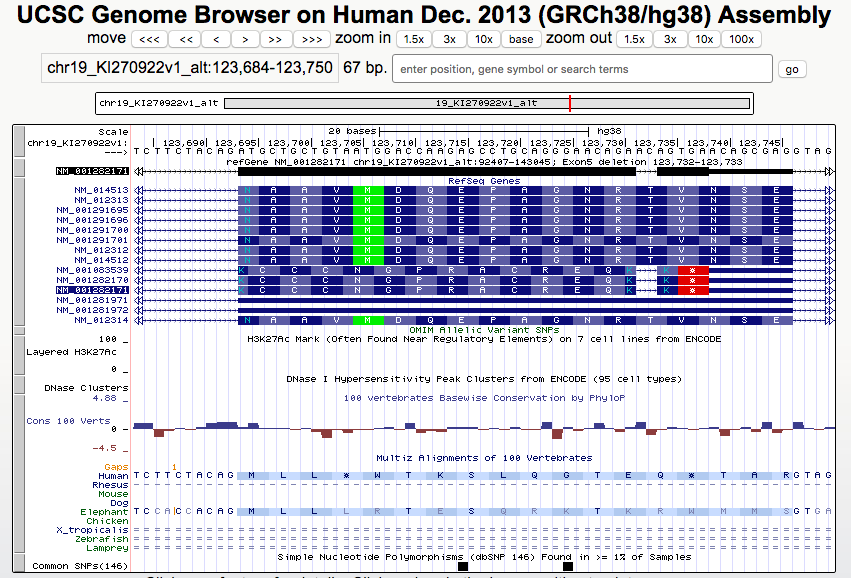
A user had written some code to generate exon frame data from the refGene table, based on the belief that the exonFrames should be possible to derive entirely from the cds{Start,End} and exon{Starts,Ends} by taking differences and dividing by three for the size of codons. However, the user noticed an inconsistency with the their generated exonFrames output compared to the information in the refGene table. In the response the explanation was that the exon frames come from the mRNA, not the genome, and the example provided (NM_001282171/KIR3DS1) represented a transcript where there were deletions in respect to the reference at chr19_KI270922v1_alt:123,732-123,733.
aacaga..agtgaacagc 000870
||||||  |||||||||| >>>>>>
aacagaacagtgaacagc 123743
By clicking into the details of the RefSeq gene NM_001282171 transcript and clicking the first link
in the section titled "mRNA/Genome Alignments" one can see the alignments of the mRNA to
the genome and find the dots aga..agt indicating a deletion.
More information about sessions
What is a session?
A session is a specific set of track combinations, that can include custom tracks allowing snapshots of browser activities. Multiple sessions may be saved for future reference, for comparing different data sets, or for sharing with your colleagues. Follow these links to learn how to create and share sessions.
What is the session gallery?
The Session Gallery is a collection of track views that help highlight viewing different topics in the browser. The sessions in the Session Gallery were created in the browser and then saved to a local file, which was then uploaded to an online location. This allows creating a single link, such as http://genome.ucsc.edu/cgi-bin/hgTracks?hgS_doLoadUrl=submit&hgS_loadUrlName=U, where U is the URL of the session file, e.g. http://www.mysite.edu/~me/mySession.txt, enabling users to maintain external control of the content file for easy update.
Public Sessions - make a Session Gallery for your laboratory!
After the creation of this Session Gallery page, UCSC created short links to sessions
and released our Public Sessions page.
Public Sessions allows users to publish their sessions and annotate them with a description.
By using the search=searchTerm feature, it is now possible for groups to create
their own laboratory-focused Session Gallery, by selecting sessions to add to the Public Sessions
collection and describing their data with common unique terms.
For example, a link to the Public Sessions page such as http://genome.ucsc.edu/cgi-bin/hgPublicSessions?search=protein will search all Public Sessions with "protein" mentioned in their description. If "protein" were replaced with "YourLabName" you could then have a link to display a gallery of sessions related to your laboratory data. Another example is http://genome.ucsc.edu/cgi-bin/hgPublicSessions?search=sessionView, which uses the unique term "sessionView" to collect related sessions. Read more in this blog post.
Don't copy that link -- make a Session!
Please see the How to share your UCSC screenthoughts and Sharing Data with Sessions and URLs blog posts for a discussion about sessions.
Most new users make the mistake of sharing a URL of the current view to others for collaboration. This can lead to many problems as each URL is given a unique identifier called a "hgsid" that allows users to continue actively manipulating their data across different platforms (FireFox,Chrome,IE). The person one shares the link with will be interpreted as the same user and will have the power to continue manipulating the original shared content.
When you want to share information in the browser in a more permanent fashion you should create a session and share the resulting URL. From the Session page, copy the link that says "Browser" with a right-click. The URL should look something like the following:
http://genome.ucsc.edu/cgi-bin/hgTracks?hgS_doOtherUser=submit&hgS_otherUserName=sessionGallery&hgS_otherUserSessionName=hg19_watsonKriek
In the above case a user name was created called sessionGallery and a session was
created called hg19_watsonKriek. This more stable link is the best way to share
information, with the only further improvement being to locally download your session file and then
remotely share it from your own private collection in an internet accessible location using the
hgS_loadUrlName= option. For example seen in this link:
http://genome.ucsc.edu/cgi-bin/hgTracks?hgS_doLoadUrl=submit&hgS_loadUrlName=http://genome.ucsc.edu/goldenPath/help/examples/sessions/encodeDemonstrationCustom Track caveats
We have changed our policy about the persistence of session data including custom tracks in sessions. In the past saved sessions were only committed to persist for four months after the last access and custom tracks in sessions were subject to persist for at least 48 hours after the last time they were viewed. We have now moved to not remove session data, unless deleted, and to not remove custom tracks in sessions. However, please note that the UCSC Genome Browser is not a data storage service, so you will want to keep backups of all your custom tracks on a local machine, just in case there is a possible loss of data due to unforeseen circumstances.
For mirrors, when loading sessions that contain custom data from custom tracks or hubs an issue can arise. If you create a session on our genome-euro or genome-asia machines with custom track data, and then try to load that session on our machine in the US, the custom track data will not populate through only the saved session file. The session only points to where the custom track data exists on a machine, and if loaded on a new machine that does not have the custom track in the same location, the custom track data will not be available to display. One fix for this issue is to load your custom tracks on both machines, then the sessions should find the data on each machine. A similar issue can occur with hubs, where different machines will have different prefixes for each hub, and so sessions on different machines will call the hubs by different unique identifiers. You can read some more information about these differences in sessions here.
Lastly, please note that track data from BLAT results will not persist like session custom tracks.
If you perform a BLAT search and create a session to keep those BLAT results, the BLAT display
will not persist. However, if you wish to make BLAT data remain, you can set the BLAT results
to "Output type: psl no header" and then paste the results into the custom track
page, perhaps giving a top line such as track name="blat"
description="My BLAT results for X,Y,Z" to describe it.